



Bathymetry Data for Coastal Streams
Bottom depth data for the micro-estuaries of the Israeli coast
Sampling was conducted during the years 2015–2023 (Table 1) using an acoustic depth sounder (Hummingbird Helix 10) mounted on a sit-on-top kayak (Figure 1). The transducer was towed on the water surface next to the kayak. Depth measurements were taken while paddling an S-shaped course between the estuary banks (Figure 2), with a temporal sampling resolution of 1 Hz.
To compensate for changes in water surface elevation in the estuaries, a height reference point was marked in the middle of each estuary before measurements began, and the vertical distance between this point and the water level was measured once an hour. After sampling all the estuaries, the elevation of the reference points in each estuary was measured relative to sea level using a DGPS system. Combining these two measurements made it possible to present the estuaries’ bottom depth relative to sea level.
Table 1: Timing and duration of sampling in the various estuaries
| Estuary | Number of sampling days | Sampling timing |
| Alexander | 5 | April–June 2015 |
| Hadera | 1 | April 2022 |
| Taninim | 1 | August 2015 |
| Lachish | 3 | April 2021 |
| Kishon | 2 | May 2021 |
| Soreq | 1 | June 2021 |
| Yarkon–Ayalon | 2 | April 2023 |
Data validation was carried out by manually checking the depth of each sampling point in comparison to surrounding points. The most common sampling error was the recording of a signal echo as depth in shallow water, which was easy to identify since it indicated deep water near the banks. These points, as well as shallow data points in the middle of the outlet, were therefore removed manually. Typically, we needed to remove fewer than one point out of every 1,000 samples in each estuary.
Due to shallow water, turbidity, and numerous obstructions, we could not sample using a motorized vessel or a multibeam depth sounder. We therefore conducted sampling by kayak, and the density of data points was lower than typical for bathymetric sampling, which required a careful choice of interpolation algorithm. Because of the estuaries’ characteristics, we chose to calculate the interpolation using a terrain-following coordinate system (a peer-reviewed article is currently in preparation).
The raw data and the interpolated data can be downloaded as CSV files via the Google Drive folder. For each of the sampled estuaries, two files are provided: raw sampling files whose names end in “Samples,” and interpolated data whose names end in “Interpolated.”
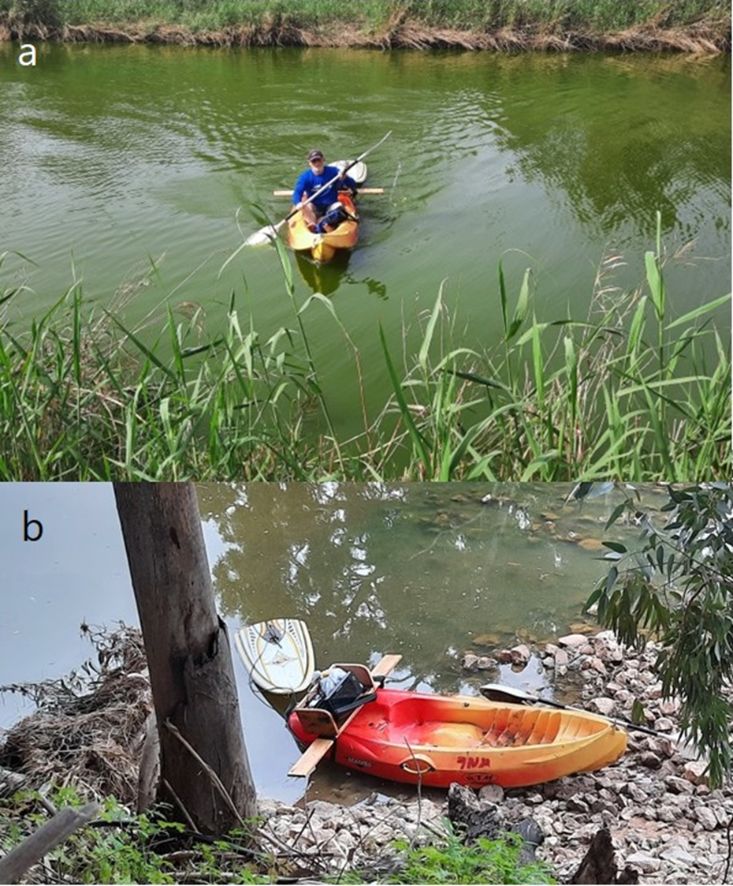
Figure 1: The sampling system in operation in the Lachish Stream estuary.